Project NOAH was publicly launched by the Philippine Government through the Department of Science and Technology (DOST), project head Dr. Mahar Lagmay, and other government officials in Marikina on July 6, 2012. It was a response to the call of late President Benigno S. Aquino III for a more accurate, integrated, and responsive disaster prevention and mitigation system, especially in high-risk areas in the Philippines. The program has been dubbed the country’s flagship program for disaster prevention and mitigation, providing a 6-hour lead time warning to agencies involved in this field. NOAH has worked on modeling and producing hydrometeorological hazard maps for floods, landslides, and storm surges that could be relevant for disaster risk reduction and management planning.
Since our 2012 launch, we have had over 3 million users of whom 51.4% are new visitors and 49.6% are returning visitors. Our website visits peak when we experience typhoon events in the country that affect various communities. Our first ever recorded website peak was in August 2013 with over 121,225 users when the Philippines experienced intense rainfall brought by the southwest monsoon (see Figure 1). The next recorded peak was in November 2013 with 181,811 users when Supertyphoon Yolanda left massive damage to the Visayas islands.
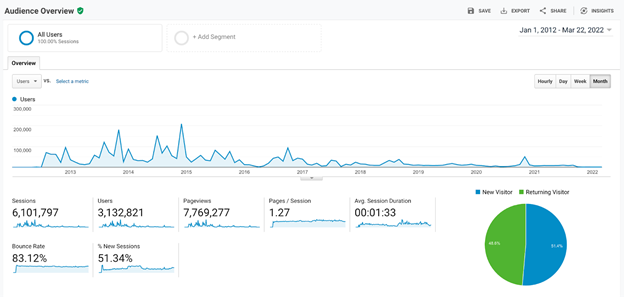
Figure 1. Audience Overview lifted from Google Analytics (2022) which covers the period Jan. 1, 2012 to Mar. 22, 2022
The highest recorded peak was in December 2014 with 209,927 users when Typhoon Hagupit/Ruby impacted the country. 2014 was also when Project NOAH became part of NDRRMC’s Pre-Disaster Risk Assessment (PDRA). This typhoon spawned devastating storm surges in Daram, Samar, a year after typhoon Haiyan killed more than 6,000 people in the Central Philippines region (Lejano et al., 2015). NOAH released storm surge advisories to communities in Samar, as well as in areas in Leyte, Camarines Sur, Biliran, Cebu, Masbate, Iloilo, Quezon, Guimaras, Albay, Capiz, Negros Occidental, Aklan, and Palawan, which pre-empted evacuation in the identified affected areas. (Read: https://www.rappler.com/moveph/77187-20141206-pm-ruby-storm-surge-warnings/)
NOAH provided NDRRMC officials with barangay-level (village-level) impact assessments of hazards from severe weather events and information on when the hazard will strike using combined forecast models (NOAH-WISE project) and interpretation and analysis of near real-time data from automated weather stations, rain gauges, and flood sensors. NOAH’s participation in the PDRA during an impending typhoon provided scenarios and advisories for LGUs exposed to the typhoon, which contributed to zero casualties in the different communities that are primarily at risk. (Read: https://www.dost.gov.ph/index.php/knowledge-resources/news/44-2015-news/876-dost-s-project-noah-launches-new-disaster-mgmnt-platform)
In 2015, NOAH launched the new and improved version of its disaster risk reduction and decision-making platform (see Figure 2). Improvements included the release of the new website user interface and completion of the hydrometeorological hazard maps that include barangay-level flood hazard maps for the major river basins, landslide hazard maps covering the entire Philippines, and storm surge hazard maps for all coastal municipalities. Although our user base decreased starting in 2015, the analytics show that there are still users who visit the website. There were spikes of over 93,000 users in July, August, September, October, and November, the same months when southwest monsoon and typhoons occur in the country.
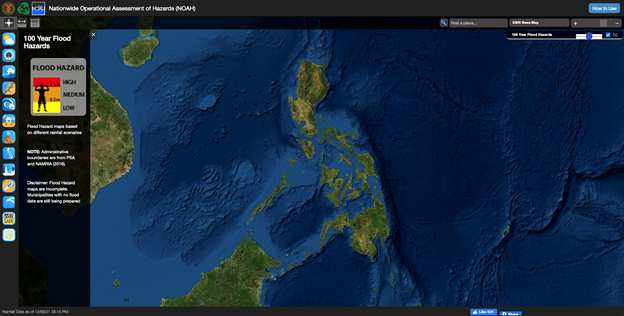
Figure 2. The NOAH website version that was released in 2015, which shows 100-year Flood Hazards in the Philippines
Where did our traffic come from?
Reviewing our acquisition data from Google Analytics (2022), we can see the top three drivers are organic visits from Google, direct traffic, and referrals from Rappler (see Figure 3). Organic visits are from individuals performing a Google search and clicking on a search engine result. Direct traffic is from users directly visiting the NOAH URL. Additionally, we are gaining users and visits directed from media articles published by Rappler that mention Project NOAH. Other drivers are referrals from PAGASA, Dr. Mahar Lagmay’s Twitter account @nababaha, Yahoo!, Facebook, Bing, ABS-CBN News, and the DOST website.

Figure 3. Recorded traffic acquisition of the NOAH website from Google Analytics (2022).
Media attention has had a huge impact on the growth of our user base since we released the website. A significant portion of our views and visits come from different media agencies which release stories related to us and help us disseminate severe weather information to the general public.
While it is interesting to see the user analytics of the NOAH website, our goal is to understand NOAH’s significance to the Filipino people. How does NOAH contribute to the country’s overall disaster risk reduction and management efforts?
Every year, there are about 20 cyclones that enter the Philippine Area of Responsibility (Dasallas et al., 2015), with about 45% of them making landfall in the country (Bankoff, 2007). In the past five years, the statistics from the Philippines were no different, with cyclones and their attendant hazards devastating the country, exacting losses and damages like clockwork (Figure 4A). Since 1986, the average total losses from property destruction per year from the impacts of hydrometeorological hazards is about USD0.94 billion a year. Supertyphoon Haiyan touted as the strongest cyclone in the country that made landfall, cost the country USD14.39 billion in losses and damages.
Meanwhile, there has been a lowered fatality count, with an average of 251 deaths/year from 2014 onwards. This was in stark contrast to the period from 1986 to 2013 when there were recorded 1,254 deaths/year on average (Figure 4B). It is also important to note that the average death count per year before 2014 was pulled higher by the fatality count recorded from Supertyphoon Haiyan. Nonetheless, even without the count from Haiyan, the average fatality count per year was at 1,021 deaths/year. Overall, the average fatality count per year was reduced by at least 75% in the last eight years.
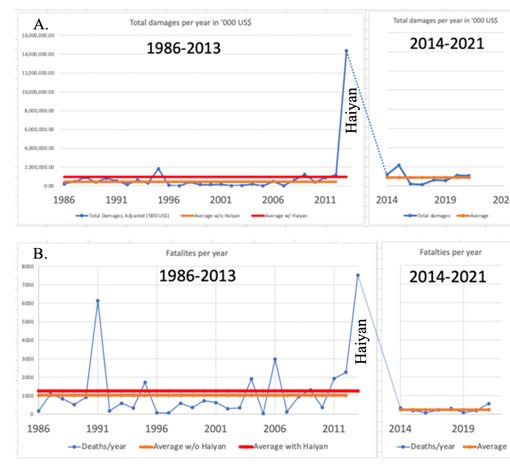
Figure 4. A) Total damages to property from hydrometeorological hazards per year adjusted to the current value in USD. B) Total deaths vs. years from 1986-2021. The period the years 2014-2021 is when there was a significant lowering in fatalities per year. Source: EMDAT
It is challenging to identify what could have happened from 2014 onwards and determine exactly what caused the 75% lower average number of deaths/year (251 deaths/year from >1,000 deaths/year). However, if no interventions were made, the average number of deaths would have remained above 1,000 fatalities per year based on counterfactual evidence derived from the EMDAT records before 2014. This imagined scenario with >1,000 deaths/year is supported by actual records on the severity of the impact of weather events, which remained more or less the same in terms of total damages throughout the period investigated. If the counterfactual narrative is true, then more than 6,000 lives were saved in the last 8 years.
Several landmark policies and activities on Climate Change Adaptation-Disaster Risk Reduction (CCA-DRR) have been implemented by the country since the year 2000, including Project NOAH. All these efforts and initiatives significantly contributed to the improvement of disaster risk reduction efforts. Still, it is essential to look at 2014, the year when a significant change in the average deaths/year happened. The inclusion of NOAH in the NDRMMC operations through the PDRA system led to many averted disasters. NOAH also pioneered the use of WebGIS and mobile applications for wider accessibility and better communication of hazards with high-resolution probabilistic hazard maps and near real-time weather information (Calvin, 2012; BAP, GMA News, 2016). Our system remains operational and has been continuously improved (Read: https://interaksyon.philstar.com/trends-spotlights/2021/10/08/201995/up-noah-finally-launches-new-website-with-hazard-assessments-of-philippine-areas/), incorporating building footprints mapped from crowdsourced efforts (eg. OpenStreetMap mapping, YouthMappers, Humanitarian OSM Team), updated population datasets from the Philippine Statistic Authority (PSA), and Facebook Data for Good and critical facilities data from government agencies (Figure 5).
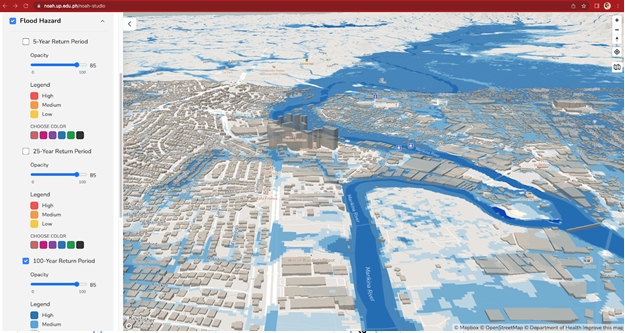
Figure 5. The revamped NOAH website (released in Oct 2021) showing scenario-based flood maps and building footprints in 3D
Want to know more about the NOAH website? Visit https://noah.up.edu.ph now! Want to collaborate with us? Contact us at [email protected].
References:
Bankoff, G. (2007). Storms of history: Water, hazard and society in the Philippines. Brill, 153-184.: https://www.researchgate.net/publication/284944104_Storms_of_history-water_hazard_and_society_in_the_Philippines
Calvin. (2012, December 27). Cyberpress awards best in local IT for 201. Retrieved April 2022, from Pinoy Tech Blog: https://pinoytechblog.com/archives/cyberpress-awards-best-in-local-it-for-2012
Dasallas, L., Gonzalo, L., Cabacaba, K., Ramos, M., Suarez, J., Santiago, J., . . . Tablazon, J. (2015, July 2). Identification of storm surge vulnerable areas in the Philippines through the simulation of Typhoon Haiyan-induced storm surge levels over historical storm tracks. Natural Hazards and Earth System Sciences.: https://nhess.copernicus.org/articles/15/1473/2015/
Google Analytics. (2022). Analytics NOAH. Google. https://drive.google.com/file/d/1BWO8gW3yuqCvxWtZQIqBI-cHjt01OhoE/view
Lejano, R., Tan, J. M., & Wilson, M. (2015, February 5). Communicating risk: Learning from Typhoon Haiyan. Nature, 518(7537, 35.: https://rdcu.be/cLev3